Version note
This article was written for NKP 2.17. The current release is 2.18. See the Upgrade to NKP 2.18 series for the latest guidance.
Most NKP debugging time is wasted at the wrong layer. Operators see a stuck HelmRelease, restart pods, comb Flux logs, then discover three hours later that the actual problem was a missing CA bundle two layers down. NKP is a deep stack: Nutanix infra at the bottom, CAPI in the middle, Kommander and Flux on top, applications at the surface. A symptom at the top almost always traces to a fault below.
This article gives you a mental model for that descent. We map symptoms to layers, give you the right command at each layer, and apply the framework to two real incidents from our lab. Every command and every output is captured live from itcs-nkp-mgmt-prod running NKP 2.17.1 on Nutanix AHV.
The NKP Stack
A failure at any layer cascades up. A pod stuck Pending looks like an app problem, but the cause may be CSI (Konvoy), the API server (control plane), a CAPI Machine that never reached Running (CAPX), or a Prism Central rate limit (Nutanix). Find the lowest unhealthy layer and fix there.
Important
KubeadmControlPlane is not the Kubernetes control plane. People conflate them constantly.
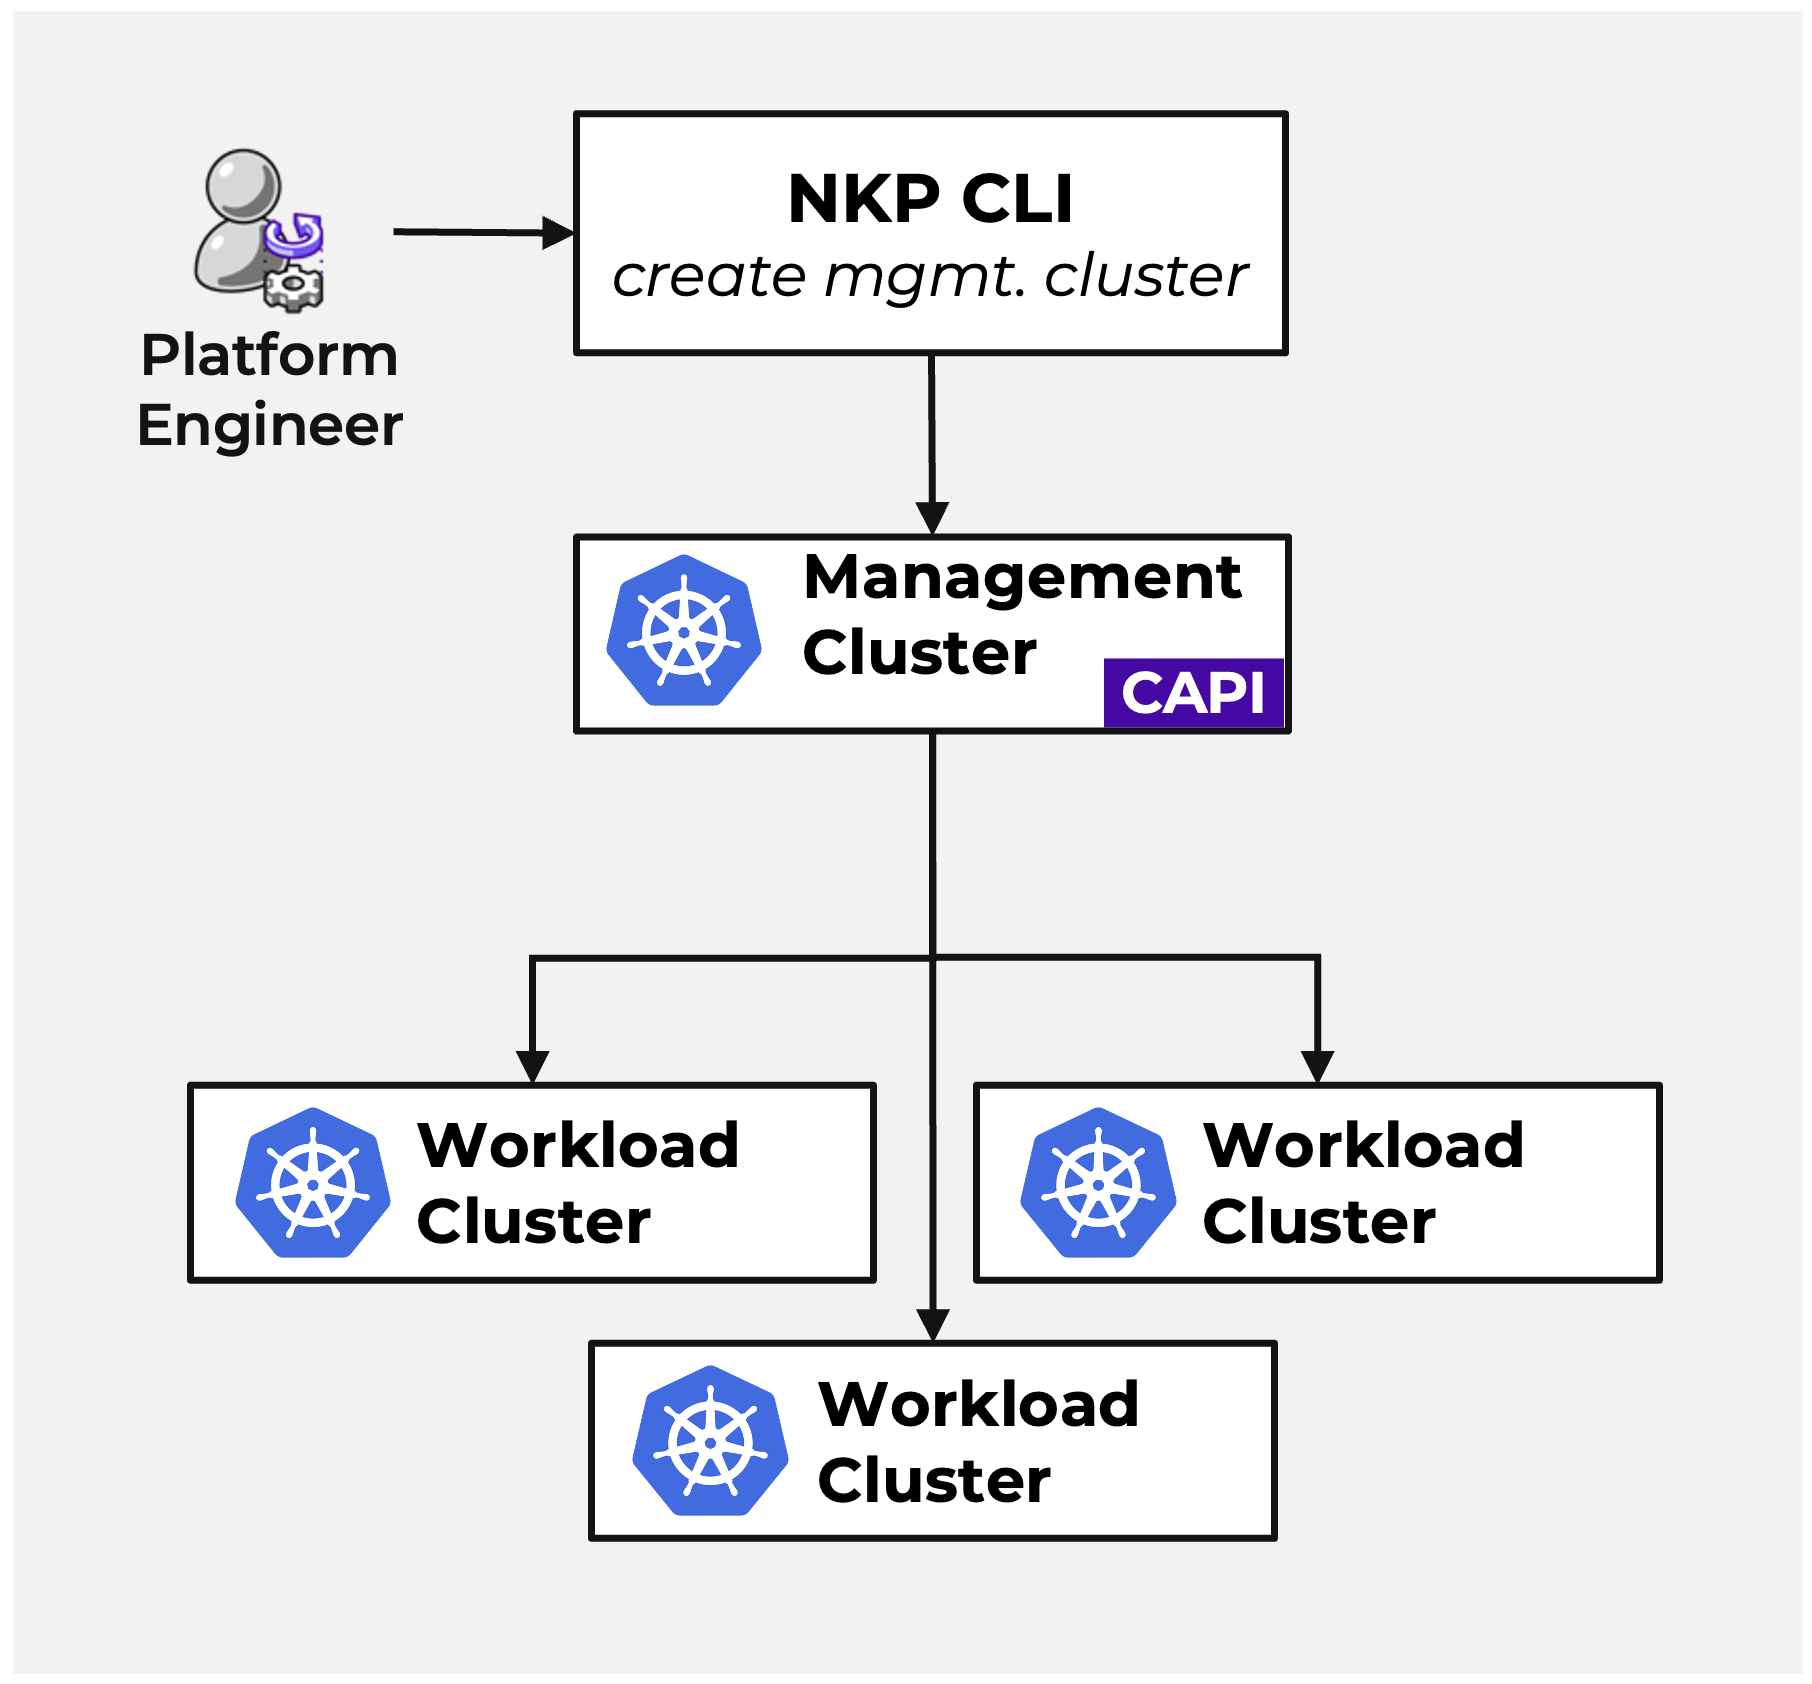
- KubeadmControlPlane (KCP) is a CAPI custom resource on the management cluster. It declares: image, replicas, kubeadm config. CAPI uses it to roll out CP nodes. Lives at the CAPI/CAPX layer.
- Kubernetes Control Plane is the running
kube-apiserver,etcd,kube-scheduler,kube-controller-managerstatic pods on the workload cluster's CP nodes. Lives at the Control Plane layer.
KCP is the recipe; the control plane is what runs. KCP Ready=False while kubectl works means the spec is broken. KCP Ready=True while kubectl hangs means the running plane is broken.
Decision Tree: Which Layer First
| Symptom | First layer to check |
|---|---|
kubectl hangs |
Control plane (apiserver, etcd, networking) |
| Cluster won't bootstrap | CAPI/CAPX (Machine, Prism Central API) |
Nodes NotReady, pods Pending |
Konvoy (CNI, kubelet, image pull) |
AppDeployment stuck |
Kommander (workspace, project, federation) |
HelmRelease Ready=False |
Flux (OCIRepository, GitRepository, values) |
Pod CrashLoopBackOff |
Workload (logs, config) |
| Dashboard / auth broken | Kommander (Traefik, Dex, MetalLB) |
| Multi-cluster pull failures | Kommander + Flux (secret propagation) |
Mgmt vs Workload: Same Symptom, Different Cluster
Federated objects (Workspace, Project, AppDeployment, KubeFedCluster) live on management. Their resulting HelmRelease and pods live on workload. Pick the right cluster before debugging.
Management cluster owns: CAPI/CAPX, Kommander, Flux source, federation, License.
| Symptom | First commands on management |
|---|---|
AppDeployment stuck |
kubectl get appdeployments -Akubectl describe appdeployment $NAME -n $WS_NS |
| Workload cluster missing from UI | kubectl get kommandercluster -A (NKP-native)kubectl get kubefedcluster -n kube-federation-system |
| New cluster won't provision | kubectl logs -n capx-system -l control-plane=controller-managerLook for 401/403 (PC credentials wrong) |
| Webhook errors on every apply | kubectl get endpoints -n kommanderkubectl get validatingwebhookconfiguration |
| Ultimate features greyed out | kubectl get licenses -A -o yaml | yq '.items[].status' |
Workload cluster owns: etcd, kubelet, CSI, Cilium, MetalLB, app pods, Flux running here.
| Symptom | First commands on workload |
|---|---|
HelmRelease not Ready |
flux get helmreleases -Aflux logs -A --level=error --tail=50 |
PVC stuck Pending |
kubectl describe pvc $NAME -n $NSkubectl logs -n ntnx-system -l app=nutanix-csi-controller |
Service Pending external IP |
kubectl get ipaddresspools -A (count allocated vs pool size) |
Node NotReady |
ssh $NODE 'sudo journalctl -u kubelet --since "10m ago"'Check date -u (clock skew kills TLS) |
etcd unhealthy |
kubectl exec -n kube-system <etcd-pod> -- etcdctl endpoint health --cluster ... |
The 5-Step Triage Flow
Run these before forming any hypothesis. Same flow on either cluster, only the kubeconfig changes.
# 1. Confirm the kubeconfig (do not triage the wrong cluster)
kubectl config current-context
kubectl cluster-info

# 2. Events first, logs second. Warnings only, sorted by recency.
#    -A: all namespaces; --field-selector: filter on event type
kubectl get events -A --sort-by='.lastTimestamp' \
  --field-selector type=Warning | tail -30

# 3. Sweep for unhealthy resources
kubectl get pods -A      | grep -vE 'Running|Completed'
kubectl get pvc,svc,helmrelease -A | grep -vE 'Bound|True'

# 4. Read .status.conditions on the failing object
KIND=hr ; NAME=velero ; NS=kommander
kubectl get $KIND $NAME -n $NS -o yaml | yq '.status.conditions'

# 5. Drill (logs / describe), only after the previous four
kubectl describe $KIND $NAME -n $NS
kubectl logs $NAME -n $NS --previous --tail=200
kubectl describe is half the battle: events at the bottom of the output usually name the trigger. Logs are the last resort, not the first.
Switch context without mistakes
Multi-cluster work is where most operator-induced incidents start: a destructive command runs on the wrong cluster.
# Per-command --kubeconfig is safest for cross-cluster work
kubectl --kubeconfig=$MGMT_KC get clusters
kubectl --kubeconfig=$WL_KC   get nodes

# Verify before any destructive op
kubectl config current-context
kubectl get nodes -o name | head -1
Capture state before any fix: nkp diagnose
nkp diagnose collects cluster state into a tarball. Run it before the fix so you have a pre-fix snapshot, and so you have something to attach when you escalate to Nutanix Support.
# --kubeconfig: path to the cluster you want to capture
# --bundle-name-prefix: optional, helps you tell bundles apart
nkp diagnose \
  --kubeconfig "$WL_KC" \
  --bundle-name-prefix "${CLUSTER_NAME}-"

# Inspect locally
tar -xzf "${CLUSTER_NAME}-"*.tar.gz
grep -ri 'error\|failed' cluster-resources/events.yaml | tail
The 7-Layer Walk
When you have no specific symptom and need a systematic health check, walk the 7 layers top-down. A failure at L1 cascades to every layer below, so resist the urge to start in the middle.
L1. Infrastructure / CAPI
# -A: all namespaces. Workload cluster CRs live in their workspace namespace.
kubectl get clusters -A
kubectl get machines -A \
  -o custom-columns='NAME:.metadata.name,PHASE:.status.phase,VERSION:.spec.version'
kubectl get kubeadmcontrolplane -A

# CAPX provider: 401/403 = Prism Central credentials wrong
kubectl -n capx-system logs -l control-plane=controller-manager --tail=200 | grep -i error
Live output:
NAMESPACE          NAME                 CLUSTERCLASS          PHASE         VERSION
debug-test-xhj92   demo-wkl-02          nkp-nutanix-v2.17.1   Provisioned   v1.34.3
default            itcs-nkp-mgmt-prod   nkp-nutanix-v2.17.1   Provisioned   v1.34.3

NAME                                        PHASE     VERSION
demo-wkl-02-md-0-9h798-zt6pn-8b6hg          Running   v1.34.3
itcs-nkp-mgmt-prod-md-0-xbscj-mmxkw-929v8   Running   v1.34.3
itcs-nkp-mgmt-prod-s5gqc-2q8bf              Running   v1.34.3
...
Both CAPI clusters Provisioned, every Machine Running. L1 healthy, descend.
L2. Node
# -o wide: shows IP, OS, kernel, container runtime
kubectl get nodes -o wide

# Non-Ready nodes with the failing condition message:
kubectl get nodes -o json | jq -r '.items[]
  | select(any(.status.conditions[]; .type=="Ready" and .status!="True"))
  | .metadata.name + ": " + ((.status.conditions[] | select(.type=="Ready")).message)'

# When the node is wedged but SSH works, drop to the host:
ssh $NODE 'sudo journalctl -u kubelet -p err --since "15 min ago"'
ssh $NODE 'date -u && chronyc tracking | head -5'    # clock skew kills TLS silently
Live output:
NAME                                        STATUS  ROLES          VERSION   OS-IMAGE                      CONTAINER-RUNTIME
itcs-nkp-mgmt-prod-md-0-xbscj-mmxkw-929v8   Ready   <none>         v1.34.3   Rocky Linux 9.7 (Blue Onyx)   containerd://1.7.29-d2iq.1
itcs-nkp-mgmt-prod-s5gqc-2q8bf              Ready   control-plane  v1.34.3   Rocky Linux 9.7 (Blue Onyx)   containerd://1.7.29-d2iq.1
All Ready, kernel 5.14, containerd 1.7.29-d2iq.1, OS Rocky 9.7. L2 healthy.
L3. Control Plane
# -l tier=control-plane: matches the static-pod label kubeadm sets on apiserver/scheduler/etc
kubectl get pods -n kube-system -l tier=control-plane \
  -o custom-columns='NAME:.metadata.name,STATUS:.status.phase,NODE:.spec.nodeName'

# /readyz exposes apiserver readiness; ?verbose returns each check's result
kubectl get --raw='/readyz?verbose' | tail -5

# etcd quorum (run inside an etcd pod, mTLS to itself)
ETCD_POD=$(kubectl get pod -n kube-system -l component=etcd -o name | head -1)
kubectl exec -n kube-system $ETCD_POD -- etcdctl endpoint health --cluster \
  --cacert=/etc/kubernetes/pki/etcd/ca.crt \
  --cert=/etc/kubernetes/pki/etcd/server.crt \
  --key=/etc/kubernetes/pki/etcd/server.key
Live output:
NAME                                              STATUS    NODE
etcd-itcs-nkp-mgmt-prod-s5gqc-2q8bf               Running   itcs-nkp-mgmt-prod-s5gqc-2q8bf
etcd-itcs-nkp-mgmt-prod-s5gqc-cc6qd               Running   itcs-nkp-mgmt-prod-s5gqc-cc6qd
etcd-itcs-nkp-mgmt-prod-s5gqc-fpbwx               Running   itcs-nkp-mgmt-prod-s5gqc-fpbwx
kube-apiserver-itcs-nkp-mgmt-prod-s5gqc-2q8bf     Running   itcs-nkp-mgmt-prod-s5gqc-2q8bf
kube-controller-manager-...                       Running   ...
kube-scheduler-...                                Running   ...

readyz check passed
3 etcd, 3 apiserver, 3 controller-manager, 3 scheduler: full HA quorum. L3 healthy.
L4. Networking
# -l k8s-app=cilium: NKP on Nutanix uses Cilium as the CNI by default
kubectl -n kube-system get pods -l k8s-app=cilium
cilium status        # if the cilium CLI is installed (it ships with NKP nodes)

# MetalLB pool. Pool exhaustion = LoadBalancer Service stuck Pending with no event.
kubectl get ipaddresspools -A
kubectl get svc -A --field-selector=spec.type=LoadBalancer | grep -i pending

# CoreDNS
kubectl -n kube-system get pods -l k8s-app=kube-dns
Live output:
NAMESPACE        NAME      AUTO ASSIGN   ADDRESSES
metallb-system   metallb   true          ["10.12.52.6-10.12.52.7"]
Pool of 2 IPs. A third LoadBalancer Service would sit Pending forever. Pool exhaustion is a frequent miss because there is no error event by default, just a Pending external IP.
L5. Storage
# StorageClass: which provisioner, what reclaim/binding mode
kubectl get sc

# PVCs not Bound
kubectl get pvc -A | grep -vE 'Bound|^NAMESPACE'

# Nutanix CSI controllers + per-node agents live in ntnx-system
kubectl -n ntnx-system get pods

# When a PVC is stuck Pending, look here:
kubectl describe pvc $NAME -n $NS
kubectl logs -n ntnx-system -l app=nutanix-csi-controller --tail=100
Live output:
NAME                       PROVISIONER       RECLAIMPOLICY   VOLUMEBINDINGMODE      ALLOWVOLUMEEXPANSION
nutanix-volume (default)   csi.nutanix.com   Delete          WaitForFirstConsumer   true
Default StorageClass present, CSI controllers and node agents Running.
L6. Platform Apps / Flux
This is where most production incidents surface. Sources first, releases second.
# Everything Flux manages, one screen
flux get all -A

# Failing HelmReleases only (column 4 is READY)
kubectl get helmrelease -A | awk '$4!="True" && NR>1'

# Errors only across all namespaces, last 100 lines
flux logs -A --level=error --tail=100
Live output (a real ongoing failure on our lab):
NAMESPACE   NAME    AGE     READY   STATUS
kommander   velero  2d22h   False   Helm install failed for release kommander/velero
                                    with chart velero@11.1.1: context deadline exceeded
51 HelmReleases ready, 1 stalled. We trace this end-to-end in Worked Example 2.
L7. Authentication / RBAC
# -l app.kubernetes.io/name=dex: Dex pod
kubectl -n kommander get pods -l app.kubernetes.io/name=dex
kubectl -n kommander logs -l app.kubernetes.io/name=dex --tail=100 | grep -iE 'error|denied'

# OIDC / LDAP / SAML connector status
kubectl get connectors.dex.mesosphere.io -A

# RBAC review for a user (substitute --as=<email>):
kubectl auth can-i --list --as=demo@itcs.local
Live output:
NAMESPACE   NAME        ENABLED   DISPLAYNAME                    TYPE
kommander   gitlab      true      Log in with GitLab (itcs-lu)   oidc
kommander   ldap-itcs   true      ITCS AD                        ldap
GitLab OIDC and corporate AD both enabled. Common L7 traps: token expiry, missing oidc: group prefix, an OIDC connector with the wrong issuer URL. Connector condition messages call them out clearly.
The 4 triage rules
- Start at L1. Always. A stuck
Machinecascades to every layer below. - Read
.status.conditionsbefore reading logs. Controllers publish why they are stuck. - Events before logs.
kubectl get events -A --sort-by='.lastTimestamp'surfaces the trigger. - Reproduce the symptom at each layer.
kubectl execinto a pod, do a DNS lookup,curla service, mount a volume. Each test eliminates a layer.
Worked Example 1: OCIRepository x509 in Air-Gapped NKP
The setup: NKP 2.17 air-gapped, Harbor as the registry mirror, flux-oci-mirror HTTPS proxy in front of Harbor. We joined a fresh workload cluster demo-wkl-02 to a workspace named debug-test. The first AppDeployment (cert-manager-crds) never went Ready.
Workspace name and the namespace it owns are different. Resolve the namespace first:
# .status.namespaceRef.name: the namespace Kommander provisioned for this workspace
WS_NS=$(kubectl get workspace debug-test -o jsonpath='{.status.namespaceRef.name}')
echo "$WS_NS"   # e.g. debug-test-xhj92
Step 1. AppDeployment is a Kommander CRD on the management cluster. It has no READY column; per-cluster status is nested in .status.clusters[].conditions.
# jsonpath range over .status.clusters[*], printing each cluster's sync condition
kubectl get appdeployment -n "$WS_NS" cert-manager-crds \
  -o jsonpath='{range .status.clusters[*]}{.name}={.conditions[?(@.type=="AppDeploymentInstanceSynced")].status}{"\n"}{end}'
# demo-wkl-02=False
Step 2. AppDeployment renders to a HelmRelease and an OCIRepository on the workload cluster, in the same workspace namespace.
KUBECONFIG="$WL_KC" kubectl get ocirepository,helmrelease -n "$WS_NS"
# ocirepository.../cert-manager-1.18.2-crds  oci://ghcr.io/mesosphere/charts/cert-manager-crds  False
# helmrelease.../cert-manager-crds                                                              False  waiting on source
The HelmRelease is blocked on the OCIRepository. Trust the lowest unhealthy object.
Step 3. Read the condition message verbatim.
KUBECONFIG="$WL_KC" kubectl describe ocirepository -n "$WS_NS" cert-manager-1.18.2-crds
Status:
  Conditions:
    Type:    Ready
    Status:  False
    Reason:  AuthenticationFailed
    Message: failed to generate transport for 'oci://ghcr.io/mesosphere/charts/cert-manager-crds':
             secret 'debug-test-xhj92/nkp-oci-proxy-ca' not found
The URL field points at ghcr.io. The flux-oci-mirror proxy is configured via proxySecretRef, not URL rewriting. The message names the missing secret directly.
Step 4. Fix: copy nkp-oci-proxy-ca from kommander on the management cluster into the workspace namespace on the workload cluster, under the exact name the OCIRepository expects, then force a reconcile.
WS_NS=$(kubectl get workspace debug-test -o jsonpath='{.status.namespaceRef.name}')

# jq: rewrite namespace, strip cluster-specific metadata
# kubectl create -f -: apply via stdin (avoids "annotations too long" on apply)
kubectl -n kommander get secret nkp-oci-proxy-ca -o json |
  jq --arg ns "$WS_NS" '.metadata.namespace=$ns
    | del(.metadata.uid,
          .metadata.resourceVersion,
          .metadata.creationTimestamp,
          .metadata.ownerReferences,
          .metadata.labels,
          .metadata.annotations)' |
  KUBECONFIG="$WL_KC" kubectl create -f -

# annotate with reconcile.fluxcd.io/requestedAt: skips Flux's exponential backoff
KUBECONFIG="$WL_KC" kubectl -n "$WS_NS" annotate ocirepository --all \
  reconcile.fluxcd.io/requestedAt="$(date +%s)" --overwrite
The OCIRepository goes Ready=True within seconds, the HelmRelease reconciles, the AppDeployment goes Ready.
The framework worked because we did not start by reading source-controller logs. We started at the failing object, descended one layer at a time, and the condition message named the missing secret directly.
Worked Example 2: A Stalled velero HelmRelease
Same framework, different layer of failure. Output captured live from our management cluster while writing this post.
Step 1. Events first.
# --field-selector type=Warning: filter to warnings only
kubectl get events -A --sort-by='.lastTimestamp' \
  --field-selector type=Warning | tail -8
kommander  HealthCheckFailed  kustomization/cluster
           timeout waiting for: [Kustomization/kommander/apps-kommander status: 'InProgress']
kommander  HealthCheckFailed  kustomization/apps-kommander
           timeout waiting for: [Kustomization/kommander/velero status: 'InProgress']
kommander  HealthCheckFailed  kustomization/velero-helmrelease
           failed early due to stalled resources: [HelmRelease/kommander/velero status: 'Failed']
kommander  Failed             pod/velero-c65f68747-79ww2
           Error: secret "dkp-velero" not found
The events form a chain: cluster → apps-kommander → velero HR → pod missing a secret. Don't act on the top of the chain. Jump to the lowest unhealthy object.
Step 2. Unhealthy resource sweep.
kubectl get pods -A | grep -vE 'Running|Completed'
# kommander  velero-c65f68747-79ww2  0/1  CreateContainerConfigError  41h

kubectl get helmrelease -A | grep -v True
# kommander  velero  False  Helm install failed for release kommander/velero with chart velero@11.1.1:
#                          context deadline exceeded
One pod, one HelmRelease, both pointing at the same release. Confirms the events.
Step 3. Read conditions on the failing HelmRelease.
# yq filters yaml; cleaner than describe for structured fields
kubectl get hr velero -n kommander -o yaml | yq '.status.conditions'
- message: Failed to install after 31 attempt(s)
  reason: RetriesExceeded
  status: "True"
  type: Stalled
- message: 'Helm install failed for release kommander/velero with chart velero@11.1.1:
    context deadline exceeded'
  reason: InstallFailed
  status: "False"
  type: Ready
Stalled=True with RetriesExceeded is Flux saying it has given up and will not retry on its own. InstallFailed with context deadline exceeded is the Helm controller surfacing a failed install hook. The install itself succeeded; the hook timed out because pods inside the chart cannot start. Descend a layer.
Step 4. Drill into the workload pod.
# Filter describe output to events + warnings
kubectl describe pod -n kommander -l app.kubernetes.io/name=velero \
  | grep -E '^Events:|Warning' | tail -5
Events:
  Warning  Failed  20s (x17561 over 2d15h)  kubelet  Error: secret "dkp-velero" not found
The pod has been retrying for over two days. The kubelet event names the missing secret directly. No log diving required.
Step 5. Verify the secret across namespaces.
kubectl get secret -A | grep dkp-velero
# (no output)
The dkp-velero secret is referenced by the velero pod's mounts but does not exist anywhere. The fix is environment-specific: the secret is normally generated by a cosi-bucket-kit BucketAccess that creates IAM credentials for the Velero S3 backend. The BucketAccess never ran because of an earlier dependency.
The framework does not need to know the root cause to point you there. Descend to the lowest unhealthy object, read the condition or event, the missing thing is named.
Diagnosis time: about 90 seconds end-to-end. The trap is starting at kustomize-controller logs (top of the event chain), which produces 30 minutes of InProgress reconciliation noise that masks the real signal four layers down.
Reading conditions like a pro
NAME=velero ; NS=kommander

# All conditions on a HelmRelease
kubectl get hr $NAME -n $NS -o yaml | yq '.status.conditions'

# Just the failing ones (skip the noisy True ones)
kubectl get hr $NAME -n $NS -o yaml \
  | yq '.status.conditions[] | select(.status=="False")'

# The Ready message on any object, single line
kubectl get $KIND $NAME -n $NS \
  -o jsonpath='{.status.conditions[?(@.type=="Ready")].message}{"\n"}'

# CAPI machine phases across the fleet
kubectl get machines -A \
  -o custom-columns='NAME:.metadata.name,PHASE:.status.phase'
Flux & Helm forensics
NAME=kommander ; NS=kommander

# Force a single source / kustomization to refetch right now
flux reconcile source git    $NAME -n $NS
flux reconcile kustomization $NAME -n $NS --with-source

# Helm history of a managed release
helm -n $NS history $NAME

# What did Flux LAST apply (for diffing against current chart)
kubectl get hr $NAME -n $NS -o jsonpath='{.status.lastAppliedRevision}'
Node-level debugging via SSH
When the API can answer but the node behind a pod cannot, drop down to the host.
NODE=10.12.52.92   # set to the target node IP

# Recent kubelet errors
ssh $NODE 'sudo journalctl -u kubelet -p err --since "15 min ago"'

# Container runtime: anything not Running
ssh $NODE 'sudo crictl ps -a -n k8s.io | grep -v Running'
ssh $NODE 'sudo crictl logs $(sudo crictl ps --name etcd -q)'

# Static pod manifests (etcd, kube-vip, apiserver, scheduler)
ssh $NODE 'sudo ls -la /etc/kubernetes/manifests/'

# Containerd mirror config (air-gap routes through Harbor)
ssh $NODE 'sudo cat /etc/containerd/certs.d/_default/hosts.toml'

# Clock skew kills TLS silently
ssh $NODE 'date -u && chronyc tracking | head -5'
Common anti-patterns
- Restarting pods before reading conditions. A restart hides the symptom and erases events. Read first.
- Searching the wrong layer's logs.
helm-controllercannot help you debug an OCIRepository fetch failure, that issource-controller. - Diagnosing on the wrong cluster. Multi-cluster setups demand discipline: which cluster is the symptom on, which cluster owns the resource that should fix it?
- Ignoring
kubectl describeevents. Events show recent state transitions and almost always reveal the trigger. - Starting at the top of an event chain. The top is a symptom. The bottom names the cause.
Summary
NKP debugging is a descent through layers. Every symptom maps to a layer. The right command at each layer is short and well-known. Read conditions before logs. Read events before drilling. Trust the lowest unhealthy object. Don't conflate KubeadmControlPlane (the spec) with the Kubernetes Control Plane (what runs).
Both worked examples followed the same path: events sweep, conditions on the failing object, condition message names the missing thing, fix or escalate. Five minutes once you have the framework. Hours of log diving without it.